In today’s data-driven world, businesses need to be able to quickly and easily access, process, and analyze large amounts of data to make informed decisions. To do this, they need robust ETL pipelines that can extract data from various sources, transform it into the desired format, and load it into a data warehouse or other storage solution.
One such popular storage solution is Amazon Redshift, a fully managed data warehouse that can handle petabyte-scale data. Redshift provides a fast, reliable, and scalable solution for storing and analyzing large amounts of structured and semi-structured data.
However, storing data in Redshift is just the first step. To extract insights from this data, businesses need to visualize it in an easy-to-understand manner. This is where Amazon QuickSight comes into play. QuickSight is a cloud-based business intelligence service that enables users to create and publish interactive dashboards, reports, and visualizations from various data sources, including Redshift.
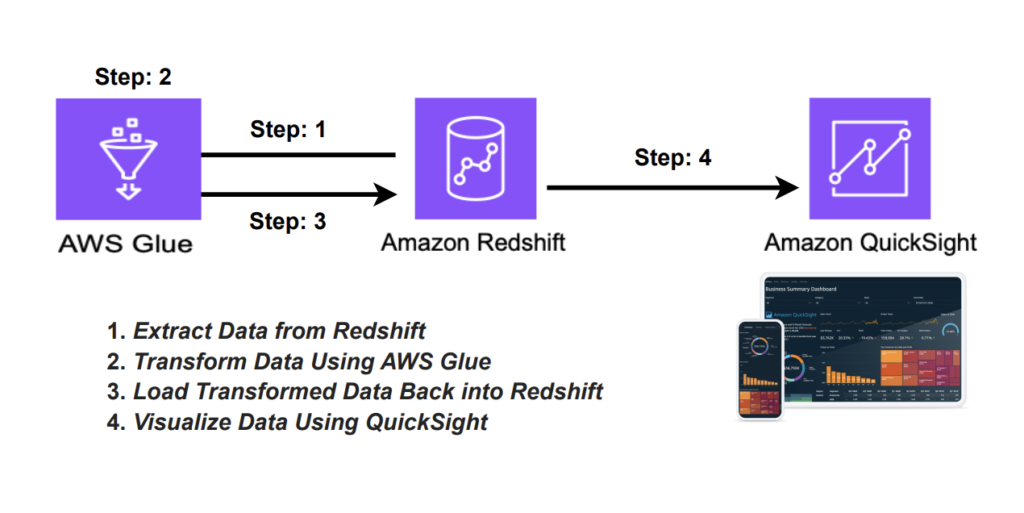
In this blog, we will discuss how to build an ETL pipeline to extract data from Redshift, transform it using AWS Glue, and load it back into Redshift for visualization using QuickSight.

Step 1: Extract Data from Redshift
The first step in building our ETL pipeline is to extract data from Redshift. We can use AWS Glue to extract data from Redshift, as it is a fully managed extract, transform, and load (ETL) service that makes it easy to move data between data stores.
To extract data from Redshift, we need to create a connection to our Redshift cluster in AWS Glue. We can do this by navigating to the Glue console and selecting the “Connections” tab. From here, we can create a new connection by providing the necessary connection details, such as the JDBC URL, username, and password.
Once we have created the connection, we can create a Glue job to extract data from Redshift. In the Glue job, we need to define the source and target data stores and write the ETL code to extract data from Redshift.
Step 2: Transform Data Using AWS Glue
The next step is to transform the extracted data into the desired format using AWS Glue. Glue provides a flexible and scalable platform for transforming data using Apache Spark, a popular open-source distributed computing framework.
To transform data using AWS Glue, we need to create a Glue job that defines the data transformation logic. This can be done using the Glue ETL code editor or by writing custom Spark code.
The transformation logic will depend on the specific requirements of the visualization we want to create. For example, we may need to join multiple tables, filter data based on certain criteria, or aggregate data into a different format.
Step 3: Load Transformed Data Back into Redshift
Once the data has been transformed, we need to load it back into Redshift for visualization using QuickSight. To do this, we can create a Glue job that loads the transformed data into Redshift.
In the Glue job, we need to define the target Redshift table and write the ETL code to load the data. We can use the Redshift JDBC driver to connect to Redshift and execute SQL queries to load the data.
Step 4: Visualize Data Using QuickSight
With the transformed data loaded back into Redshift, we can now use QuickSight to create interactive dashboards and visualizations. QuickSight provides a user-friendly interface for creating visualizations and allows us to connect to various data sources, including Redshift.
To create a visualization in QuickSight, we first need to create a data source that points to our Redshift cluster. Once the data source is created, we can use the QuickSight interface to create a new analysis and add visualizations to it.
QuickSight offers a range of visualization types, such as bar charts, line charts, tables, and maps. We can customize the visualizations by changing colors, fonts, and labels, and adding interactivity such as drill-downs, filters, and actions.
Once we have created our visualization, we can publish it to a dashboard that can be shared with other users. QuickSight also offers various sharing and collaboration options, such as embedding dashboards in websites, sharing dashboards with specific users or groups, and setting up scheduled email reports.
Conclusion
Building an ETL pipeline to extract, transform, and load data from Redshift using AWS Glue and visualizing it using QuickSight can provide businesses with a powerful tool to analyze and make informed decisions based on their data. By following the above steps, businesses can create a flexible and scalable ETL pipeline that can handle large amounts of data and generate interactive visualizations and dashboards that can be easily shared with others.
